Getting Started
You've received your invite and you're looking at QuantAssure for the first time. This page gets you oriented: sign in, understand what your role can do, and learn where everything lives — then start the onboarding journey.
QuantAssure is a security assurance platform for CISOs and security leads: it collects findings from the systems you already run, uses AI to reclassify each finding's severity against your organisational context, drives remediation SLAs from those adjusted severities, and packages everything — including the AI's own decisions — as audit-ready evidence.
The Five-Minute Quickstart
The whole journey, compressed — each step is covered in depth by its own numbered page in the sidebar:
- Sign in at your QuantAssure URL (accounts are invite-based — your administrator sends an invite link)
- Connect a system — Scopes → Add Scope, pick a source type (GitHub, AWS, Google Workspace, Mosyle…), and enter its credentials. See Connect your first system.
- Run a collection — trigger the first run from the scope page. Findings appear in Findings within minutes.
- Watch the AI triage — each finding gets an AI-adjusted severity with reasoning. A "critical" scanner alert that poses no real risk in your environment is reclassified down — with the justification one click away. See Your first findings.
- Export the evidence — Reports → New Report → AI Decision Audit Trail gives you every AI decision in the period, as a PDF your auditor can hold. See Your first audit pack.
Accounts and Organisations
QuantAssure is multi-tenant: your organisation holds your systems, findings, policies, and evidence, isolated from every other tenant. Accounts are created by invite — an administrator adds you from Organization → Members, and you receive a signup link.
| Role | What it can do |
|---|---|
| Owner / Admin | Manage settings, members, and integrations |
| Member | Work with findings and evidence |
| Viewer | Read-only access |
The Dashboard
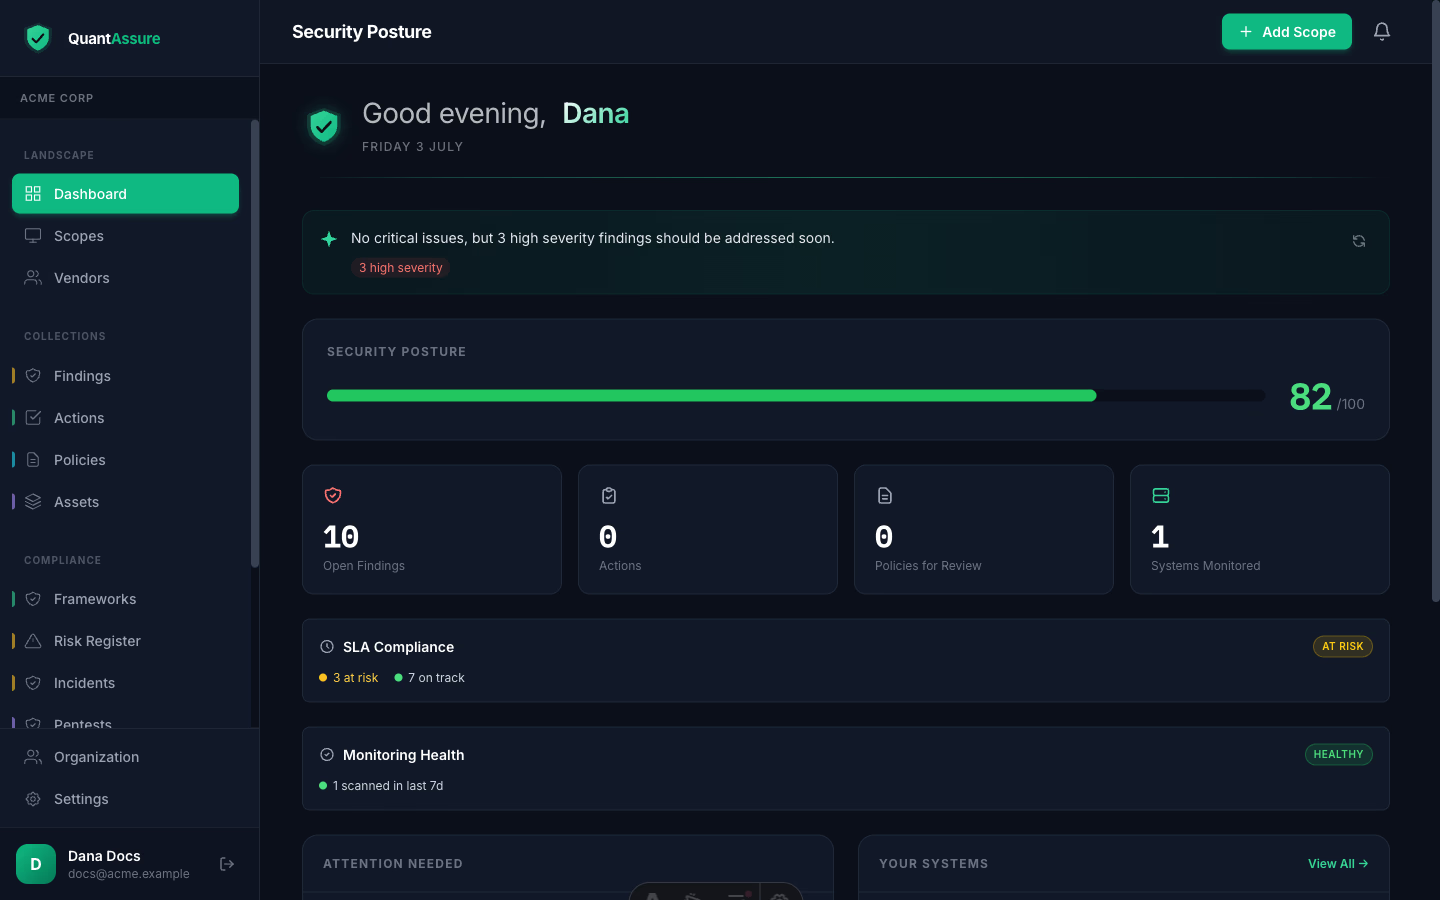
The home dashboard is your security posture at a glance:
- Security Posture score (0–100) — computed from your open findings using AI-adjusted severities, not raw scanner ratings, so the score reflects actual risk
- Stat tiles — open findings, action items, policies due for review, systems monitored
- SLA Compliance strip — how many open findings are breached / at risk / on track against your remediation deadlines. Each count links to the pre-filtered findings list. See SLA Policies.
- Monitoring Health — whether your connected systems have reported recently
- Attention Needed — the findings that most deserve your next hour, ranked by AI-adjusted severity and risk score
Where Things Live
| Section | What's there |
|---|---|
| Scopes | Your connected systems and their collector configuration |
| Findings | Every issue, AI-triaged, from all sources |
| Actions | Remediation tasks, many drafted by the AI from findings |
| Policies | Your security policies — imported or authored in-app |
| Frameworks / Risk Register / Incidents / Pentests | Compliance posture, risks, incident records, penetration test tracking |
| Reports | Point-in-time evidence exports (PDF/CSV/JSON) |
| Organization | Org-level settings: members, risk tolerance, SLA policy, notifications |
Next step → Connect your first system — create a scope, configure a collector, and trigger your first run. The rest of the journey (findings, SLA policy, notifications, your first audit pack) follows from there.